FAQ · COMMON QUESTIONS · ONE PLACE TO LINK

Common questions about SDES tools, Bookmap, and Sierra Chart

A growing reference of the questions that come up most often about SDES indicators and addons, plus the Bookmap and Sierra Chart configuration tips needed to get them running. Use this page as a quick-link target instead of repeating the same answers in chat.

Don't see your question? Email it to [email protected] — if it's a repeat, it'll get added here.

General & Licensing

About SDES, support, and licensing

Are SDES tools affiliated with Bookmap, Sierra Chart, TraderLab, or TicinoTrader?

No. SDES is an independent one-person software studio. SDES is not affiliated with, endorsed by, sponsored by, or connected in any way to Bookmap, SierraChart, TradeStation, OptimusFLOW, Interactive Brokers, NinjaTrader, TraderLab, Tom B., TicinoTrader, or any other trading platform, data provider, broker, community, methodology author, chartbook provider, or third party referenced on this site. All product and company names are trademarks of their respective owners, referenced solely to describe software interoperability or chart configuration context.

Why does Windows / my antivirus warn me when I download an SDES EXE?

SDES EXEs are not code-signed yet. Code-signing certificates run several hundred dollars per year, which isn't yet justified for a one-person operation. SmartScreen warnings on a never-before-seen unsigned EXE are normal.

Every product page that ships an EXE lists the current SHA-256 hash — verify the file you downloaded matches what was published before running it. If the hash matches, the file is the one Sean built and uploaded.

How does support work — what's free vs paid?

Paid SDES products (BMBridge, VPOC Migration Pro): email [email protected] for questions or bug reports — real reply within 1–2 days, no charge, no ticket cap.

Free tools (BMBridge Lite, HVN Marker, LVN Marker, the TradingView indicator): bug reports are welcome via the same email, but how-to questions are not personally answered for free — start with the included documentation or a modern AI assistant (ChatGPT, Claude, Gemini). They handle most configuration questions instantly.

For live screen-share time on any product, book a 1-on-1 session at /help/.

BMBridge / BMBridge Lite

BMBridge questions

BMBridge bridges your CSV levels into Bookmap Cloud Notes and adds Auction Market Theory intelligence on top. Product page →

What's the difference between BMBridge and BMBridge Lite?

BMBridge Lite is the free CSV → Cloud Notes bridge. BMBridge (paid) adds the AMT intelligence layer on top — per-instrument Spoken Session Journals, level lifecycle tracking, and the rest of the paid feature set. See /bmbridge/ for the full feature comparison.

More BMBridge questions will land here as they come up. Got one that should be on this list? Email [email protected].
VPOC Migration Pro

VPOC Migration Pro questions

The Bookmap Marketplace addon that tracks daily VPOC migration patterns. Product page →

What's a VPOC and what does "migration" mean here?

VPOC is the Volume Point of Control — the single price level where the most volume traded during a defined session. "Migration" refers to the way the developing VPOC shifts up or down throughout an RTH session as new volume gets distributed. VPOC Migration Pro tracks every shift bar-by-bar and writes a per-session log.

Deeper background: What is VPOC, Developing VPOC, Migration explained.

Where does VPOC Migration Pro write its session logs?

C:\BookMap Indicators\vpoc_session_log_YYYY-MM-DD.txt. One file per rotation day. Events inside carry actual wall-clock timestamps, so day attribution always reflects the real event time — not the filename.

More VPOC Migration Pro questions will land here as they come up. Got one that should be on this list? Email [email protected].
HVN & LVN Marker

HVN Marker & LVN Marker questions

Free Bookmap addons that mark High-Volume Nodes and Low-Volume Nodes. HVN → · LVN →

What's the difference between an HVN and an LVN?

HVN (High-Volume Node) = a price level where heavy volume accumulated; expected to act as support/resistance on revisits. LVN (Low-Volume Node) = a price level with thin volume; expected to be traversed quickly or rejected sharply. The markers render these on the Bookmap chart so you can see them in context with current price action.

More HVN / LVN questions will land here as they come up. Got one that should be on this list? Email [email protected].
AMT ForeSight · Coming soon

AMT ForeSight questions

Bookmap addon in development — auction-market priors framed live inside the Bookmap chart. See the product card →

What is AMT ForeSight?

AMT ForeSight is a Bookmap addon that frames auction-market priors directly on the chart — probabilities, not predictions. The first release covers a 17-level Stats by Target table with dual Stat % / My % rates, an automatic 12:1 stat banner, a 7-chip opening-context classification, and (in the Pro tier) the IBC / IBF / IB30 framework as a live state machine.

It's currently in development with a new license model. The product card on the homepage will show "Download" / "Buy" actions once released.

What data feeds are supported at first release?

The first release requires a Rithmic data feed. ForeSight reads ticks directly from your Rithmic broker connection while running inside Bookmap — so as long as your broker routes you through Rithmic, you're good.

Using Bookmap's own data feeds (Bookmap-native, CQG, IQFeed, or any other provider Bookmap supports) requires Bookmap's developer approval of the addon. That review is pending. Once approved, ForeSight will be able to source data directly from whatever Bookmap is already showing, and the Rithmic requirement goes away.

What's in the feature set at launch?

  • 17-level Stats by Target table — dual Stat % / My % rates side by side
  • Automatic 12:1 stat banner — surfaces the headline rule of thumb at-a-glance
  • 7-chip opening-context classification — auto-tags the session's open
  • Pro tier: IBC / IBF / IB30 framework — live state machine with a conditional cascade
  • Backfill + replay-safe CSV snapshots — so the addon's state survives replay restarts and is auditable after the session
More AMT ForeSight questions will land here as the release approaches. Got one that should be on this list? Email [email protected].
TradingView Indicator

SDES Daily VPOC Migration (TradingView) questions

Free Pine v6 indicator for TradingView. Tracks daily VPOC with extension lines for naked-vs-tested context.

What does the indicator actually plot?

Each day's final RTH VPOC, extended forward as a horizontal line. When price returns and touches a prior-day VPOC, that line freezes and recolors so naked vs. tested levels are obvious at a glance. Default is tuned for ES on a 1-minute chart with a 1-minute opening buffer (skips 9:30:00–9:30:59 ET).

More TradingView indicator questions will land here as they come up. Got one that should be on this list? Email [email protected].
HindSight

HindSight questions

Trading journal application. Product page →

HindSight questions will land here as they come up. Got one that should be on this list? Email [email protected].
Bookmap Configuration

Bookmap settings & setup

Bookmap-side configuration tips relevant to running SDES tools — Cloud Notes setup, addon installation, data feeds, and the settings that matter for getting the addons working.

How do I install a Bookmap addon (JAR or folder)?

In Bookmap: Settings → Configure API plugins → Add, then select the folder containing the addon's .jar file. Bookmap loads every JAR in the folder. After adding, restart Bookmap so the addon registers in the chart menu.

How do I enable Cloud Notes so BMBridge and the other addons can render?

Step-by-step instructions are on Cloud Notes VPOC setup. Short version: in Bookmap, enable the Cloud Notes panel for the instrument, then point BMBridge at the CSV that contains your levels — they'll appear as rendered notes on the chart.

More Bookmap configuration questions will land here as they come up. Got one that should be on this list? Email [email protected].
Sierra Chart Configuration

Sierra Chart settings & setup

Sierra Chart configuration tips for traders running SDES tools alongside SC — exporting CSV levels for BMBridge, RTH session settings, ACSIL exporter behavior, and other recurring SC questions.

How do I set up Sierra Chart to display daily VPOCs and naked VPOCs like Sean's chart?

Source: Sean's chart layout comes from a downloadable Sierra Chart chartbook by TicinoTrader — subscribers at ticinotrader.ch get pre-configured chartbooks for Sierra Chart, which is the fastest way to replicate this exact setup (settings, the volume profile study, and the bottom-bar reference spreadsheets all ship together). SDES is not affiliated with TicinoTrader — the settings below are documented here so you can match the core configuration manually if you prefer.

If you're configuring manually, three things have to be set together: the chart bar period, the session times, and the Daily Volume Profile study with POC extension turned on.

1. Bar Period  [Bar Period] menu

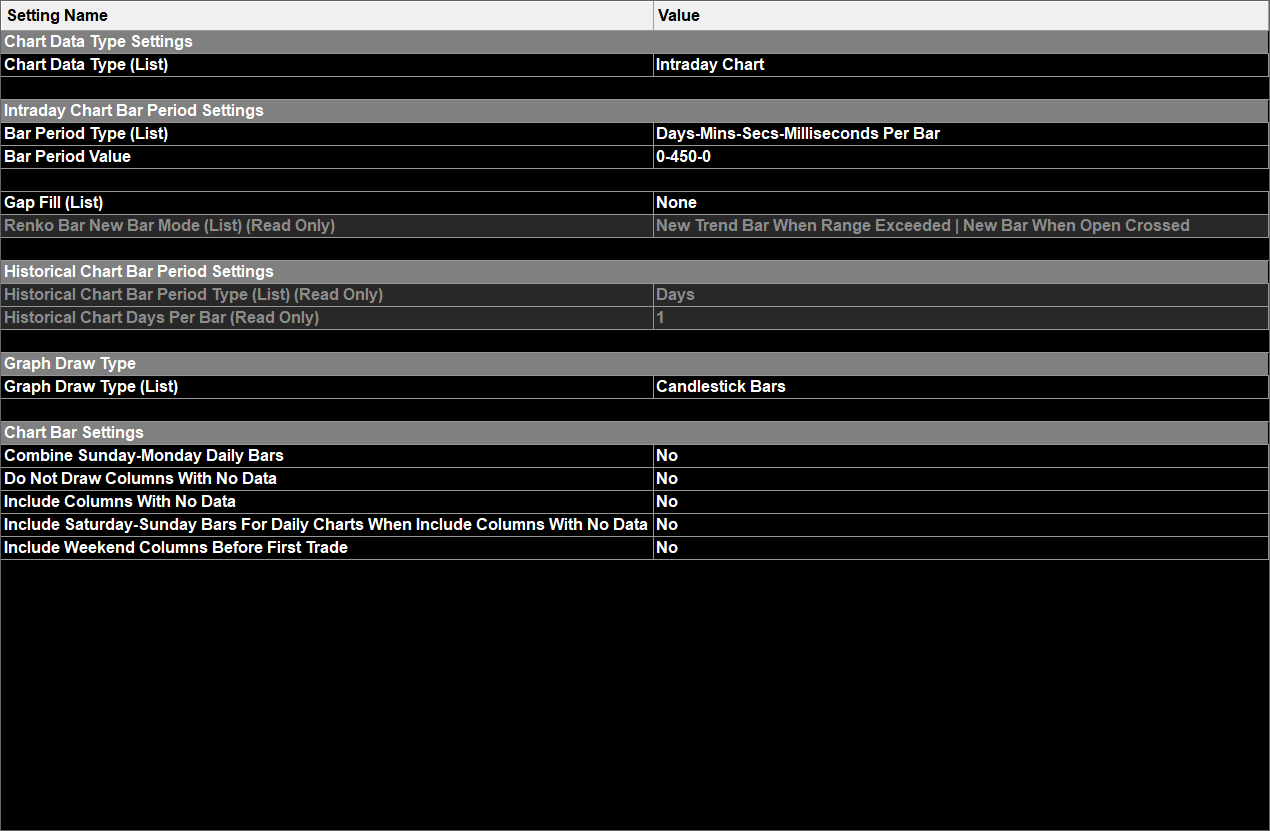
  • Chart Data Type: Intraday Chart
  • Bar Period Type: Days-Mins-Secs-Milliseconds Per Bar
  • Bar Period Value: 0-450-0 (450-minute bars — one bar per full RTH session)
  • Graph Draw Type: Candlestick Bars
Sierra Chart Bar Period dialog showing Intraday Chart, Days-Mins-Secs-Milliseconds Per Bar, value 0-450-0, Candlestick Bars draw type, all weekend bar settings set to No Sierra Chart → Bar Period settings

2. Session Times  [Session Times] menu

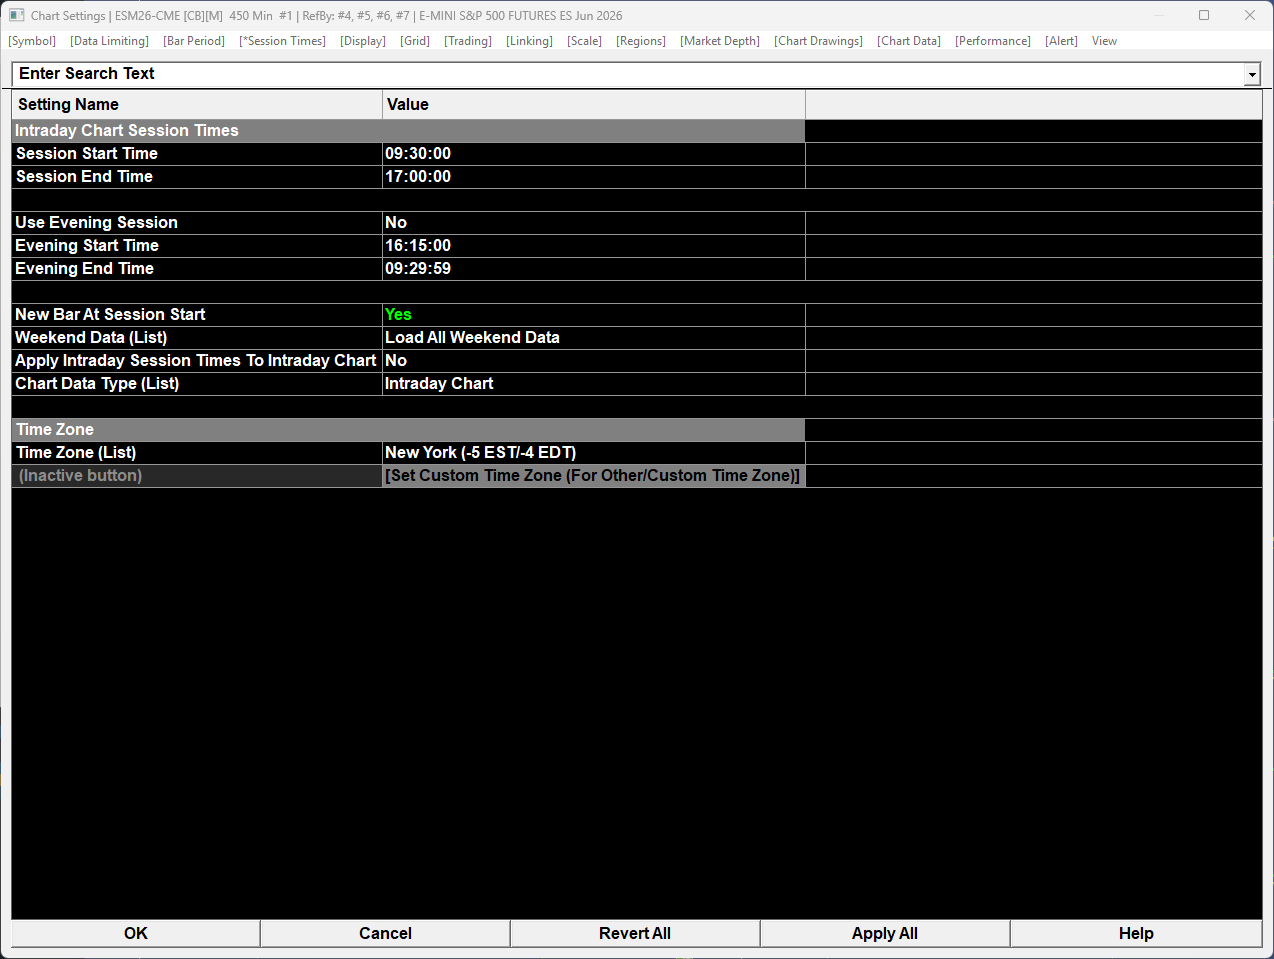
  • Session Start Time: 09:30:00
  • Session End Time: 17:00:00
  • Use Evening Session: No
  • New Bar At Session Start: Yes
  • Time Zone: New York (-5 EST / -4 EDT)
Sierra Chart Session Times dialog showing 09:30:00 start, 17:00:00 end, no evening session, time zone New York Sierra Chart → Session Times settings

3. Daily Volume Profile (VbP) study  Analysis → Studies → Add → Daily Volume Profile (VbP)

  • Volume Graph Bar Period Type: Multiple Profiles Based
  • Time Period Type for 'Fixed Time': Days
  • Number of Bars for 'Based On Bar Count': 50 (shows 50 daily profiles back)
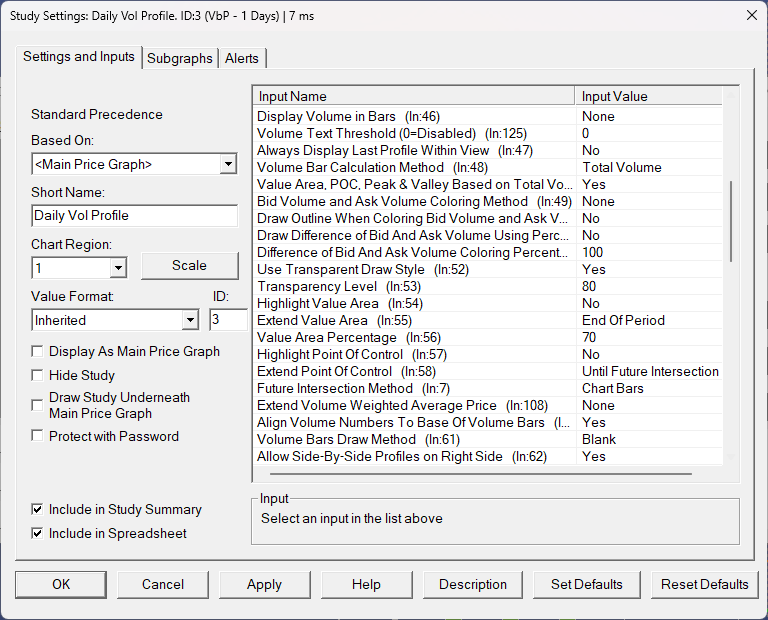
  • Volume Bar Calculation Method: Total Volume
  • Value Area Percentage: 70
  • Extend Point Of Control: Until Future Intersection  — this is what extends each daily POC line forward until price retests it (the "naked POC" behavior)
  • Future Intersection Method: Chart Bars
  • Extend Value Area: End Of Period
  • Use Transparent Draw Style: Yes; Transparency Level: 80
  • Maximum Volume Bar Width Type: Period Length; Width Percentage: 75
  • Display Data in Chart Values Window: Yes
  • Show Chart Values On Profile: Do Not Show Chart Values
  • Chart Values Position On Profile: Top of the Graph
  • Text Font Size: 10
  • Use Large Number Display Formatting: Yes
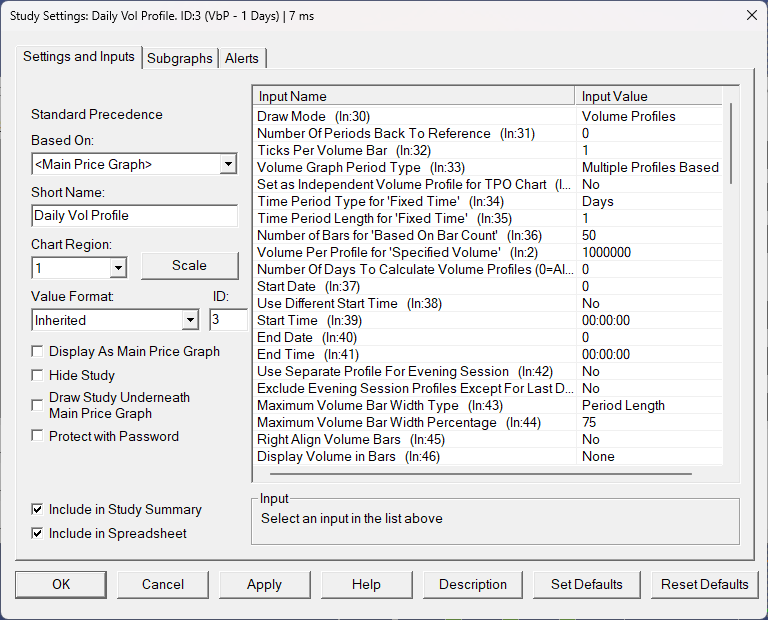
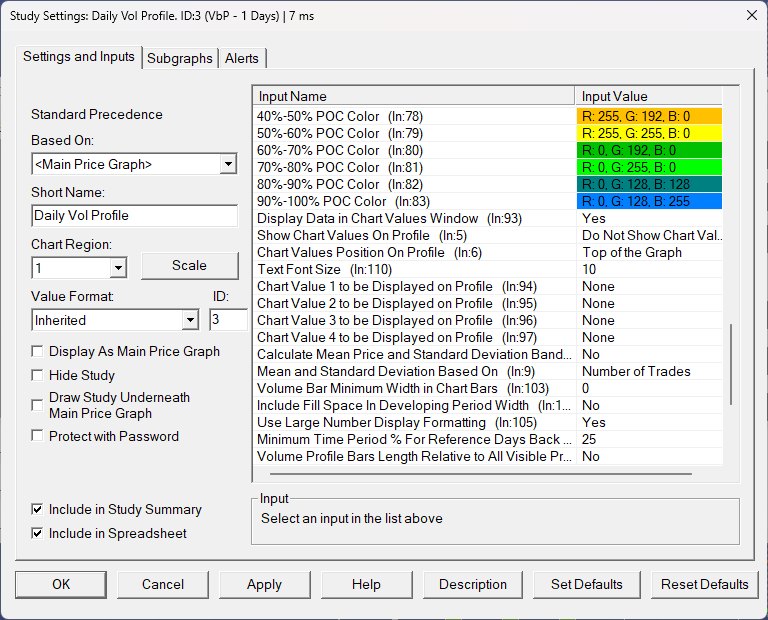
Daily Volume Profile study inputs page 1: Draw Mode = Volume Profiles, Time Period Type = Days, Number Of Bars 50, Volume Graph Period Type Multiple Profiles Based
Inputs page 1
Daily Volume Profile study inputs page 2: Value Area Percentage 70, Extend Point Of Control Until Future Intersection, Future Intersection Method Chart Bars, Use Transparent Draw Style Yes Transparency 80
Inputs page 2 — POC extension
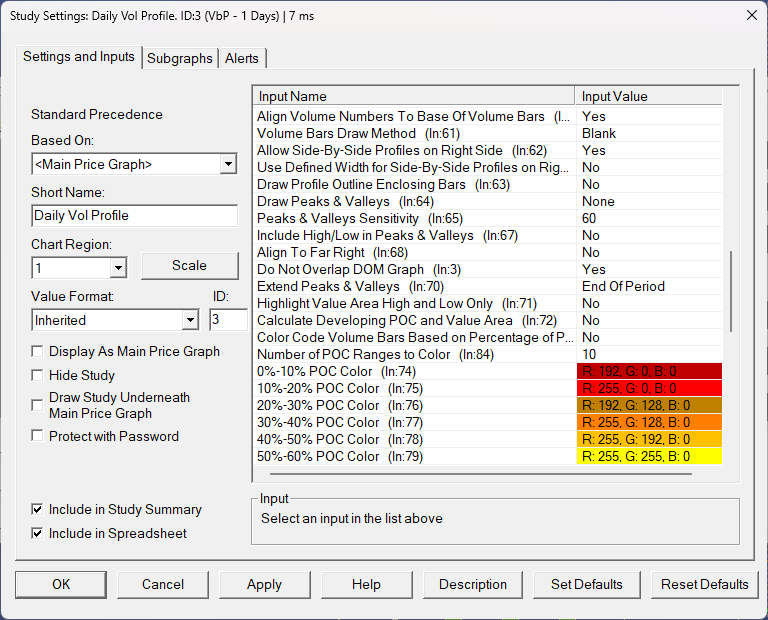
Daily Volume Profile color inputs first half: Number of POC Ranges to Color 10, POC color bands 0-10% dark red through 50-60% yellow
POC colors 0%–60%
Daily Volume Profile color inputs second half plus chart values config: POC colors 40-50% through 90-100% blue, Display Data in Chart Values Window Yes, Chart Values Position Top of the Graph, Text Font Size 10, Use Large Number Display Formatting Yes
POC colors 40%–100% + chart values

4. Color-graded POC labels (optional)

In the same Daily Volume Profile study, set Number of POC Ranges to Color = 10, then set each color band so newer POCs render hot and older POCs cool. Sean's palette:

  • 0%–10% POC Color: R 192, G 0, B 0  (dark red — newest)
  • 10%–20%: R 255, G 0, B 0
  • 20%–30%: R 192, G 128, B 0
  • 30%–40%: R 255, G 128, B 0
  • 40%–50%: R 255, G 192, B 0
  • 50%–60%: R 255, G 255, B 0
  • 60%–70%: R 0, G 192, B 0
  • 70%–80%: R 0, G 255, B 0
  • 80%–90%: R 0, G 128, B 128
  • 90%–100%: R 0, G 128, B 255  (blue — oldest)

Why don't my Sierra Chart VPOCs exactly match Tom B's (or another trader's)?

Different data providers compute slightly different VPOC values. Tom B's setup uses IRT (Investor R/T); the Sierra Chart configuration above uses Sierra Chart's own data and aggregation. Differences of several points on the same trading day are normal and not a bug.

Example from a recent comparison: May 20, 2026 — Sierra Chart showed the nVPOC at 7451.50, IRT showed it around 7440. Each platform has its own tick aggregation logic, session boundary handling, and historical data source — those small accounting differences compound into the final POC price.

The only way to match a specific platform's numbers exactly is to be on that same platform. Treat each VPOC as a zone, not a tick-precise level — the structure of the migration is more important than the exact value of any single print.

What do the colored numbers on the right and left side of the chart mean?

Sean's chart has two separate label sets:

  • Right side, orange numbers — naked POCs (prior-session POCs that haven't been retested yet). These come from the Daily Volume Profile study's "Extend Point Of Control: Until Future Intersection" setting.
  • Left side, numbers — every POC for reference, regardless of whether it's been tested. These come from a third-party Sierra Chart spreadsheet study (TicinoTrader_Combined-TPO-CompositeVP, visible in the chart tab name) that ships as part of the TicinoTrader chartbook described in the setup answer above — not a native Sierra Chart feature and not part of SDES.
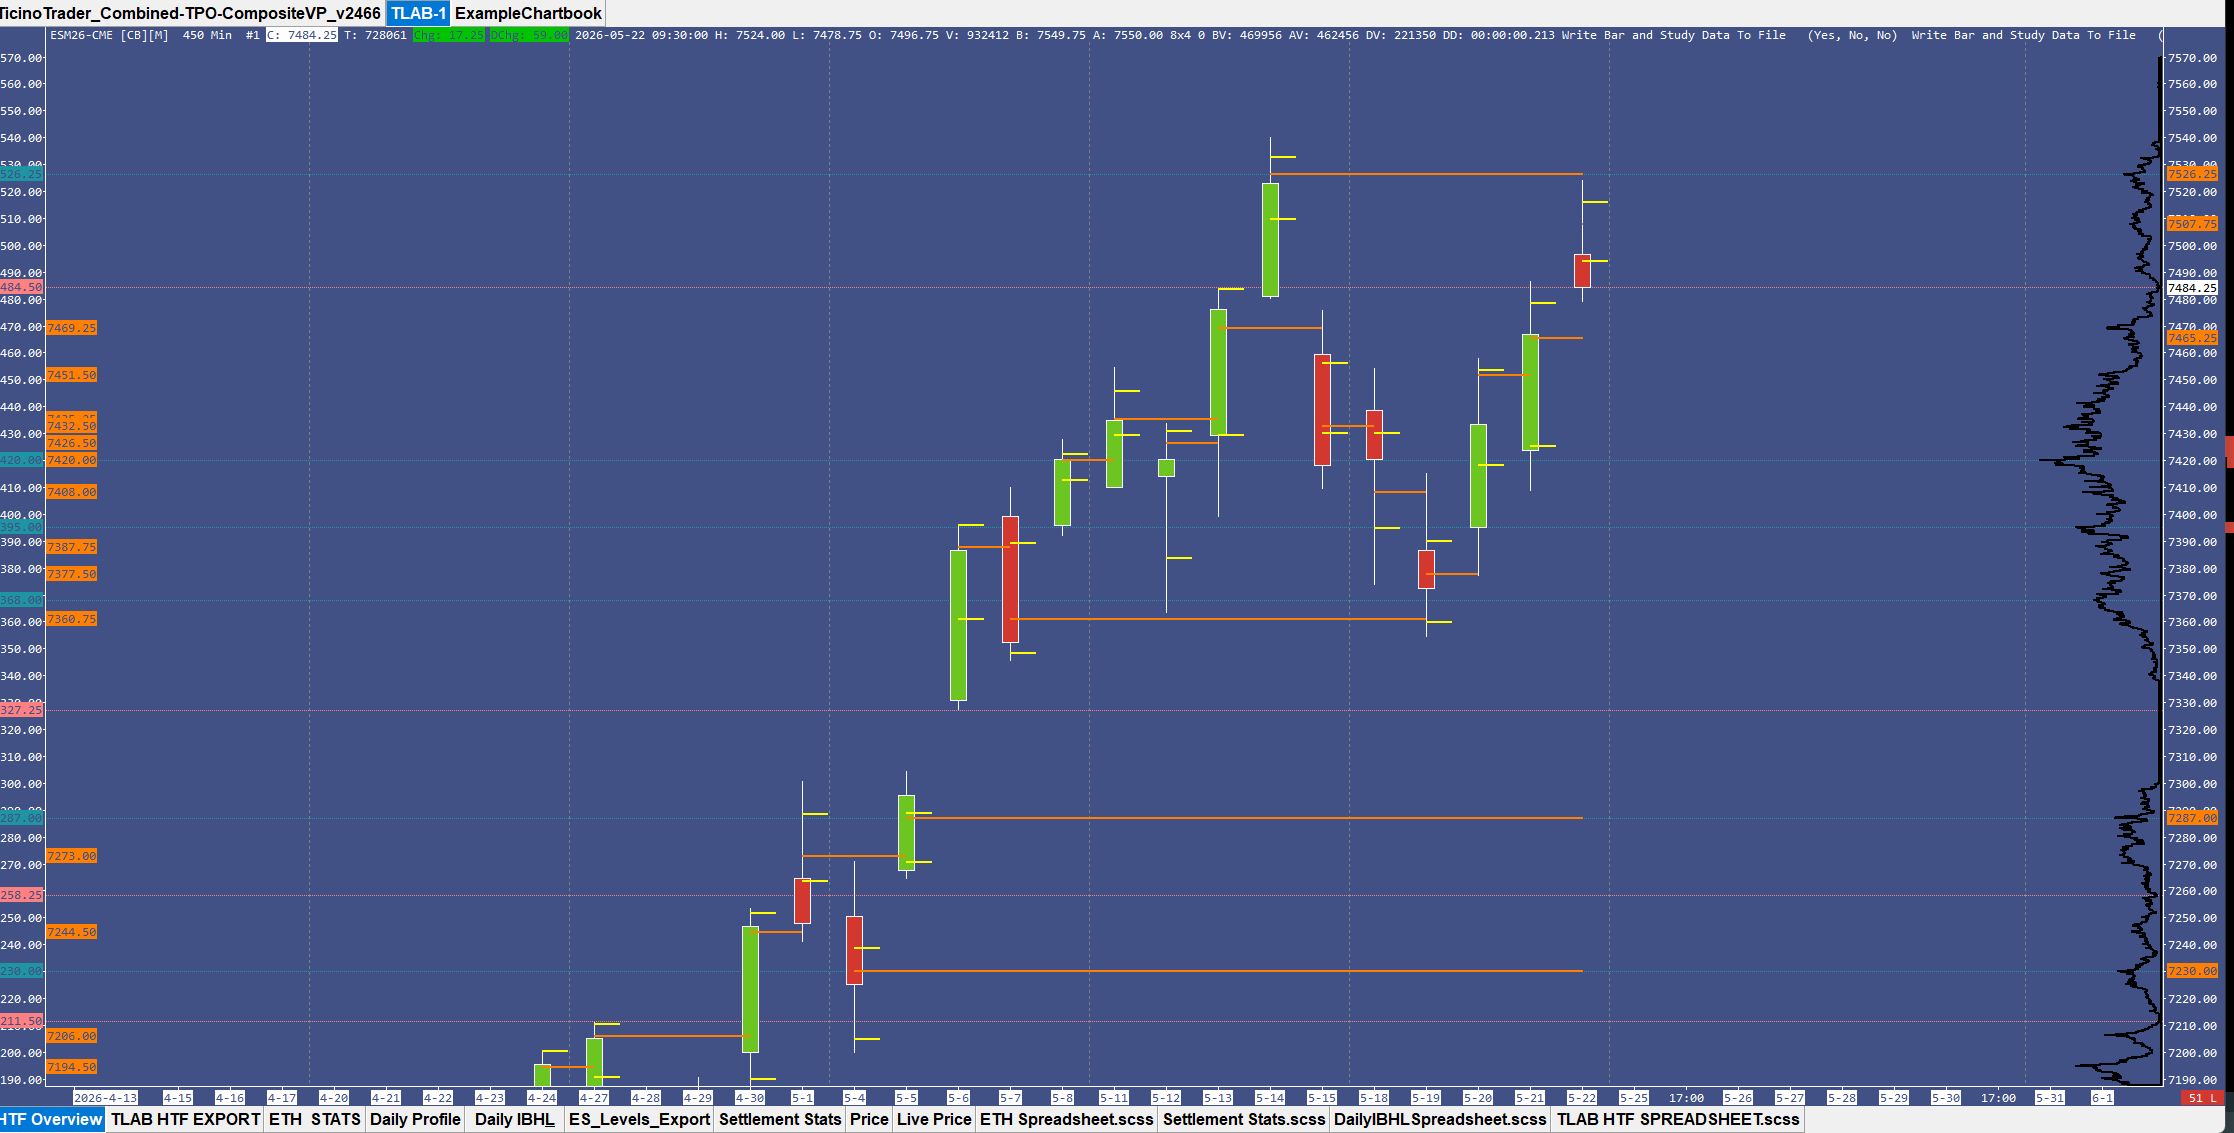
Sierra Chart with 450-minute ES bars: orange numbered labels on the right side mark active naked POCs being extended forward; orange and teal labels on the left mark historical POCs from a third-party spreadsheet study Chart view — right-side orange = naked POCs (native SC); left-side labels = TicinoTrader study

The red → orange → yellow gradient on the POC bars themselves is the "0%–10% POC Color" through "90%–100% POC Color" range described in the setup answer above — newer POCs render in the hottest color, fading as they age.

More Sierra Chart questions will land here as they come up. Got one that should be on this list? Email [email protected].

⚠ Important: not financial advice

Everything on this page is software help only. Nothing here is trading advice, investment advice, or a recommendation to enter or exit any position. SDES software is a tool — all trading decisions are 100% the user's responsibility. SDES accepts no liability for trading outcomes, financial losses, or any decision made as a result of information on this page.